Row

Duration of the infectious period

Row

Evidence of Host-host transmission?

The systematic literature review included a total of 139 articles, which combined presented evidence from 337 animal groups subjected to experimental infections with this agent. Host-to-host transmission was reported in 1 animal groups, and investigated but not found in 3 animal groups. Host-to-host transmission was not investigated or not explicitly reported for 333 animal groups.

Row

Evidence of transplacentary transmission?

The systematic literature review included a total of 139 articles, which combined presented evidence from 337 animal groups subjected to experimental infections with this agent. Transplacentary transmission was reported in 0 animal groups, and investigated but not found in 0 animal groups. Transplacentary transmission was not investigated or not explicitly reported for 337 animal groups.

Row

     META-ANALYSIS

Row

Duration of the infectious period: Meta-analysis accounting for censoring

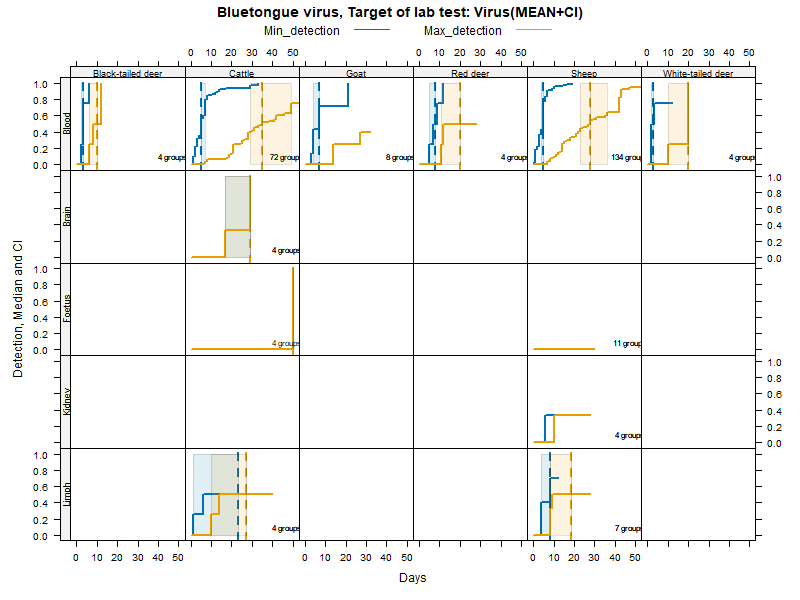
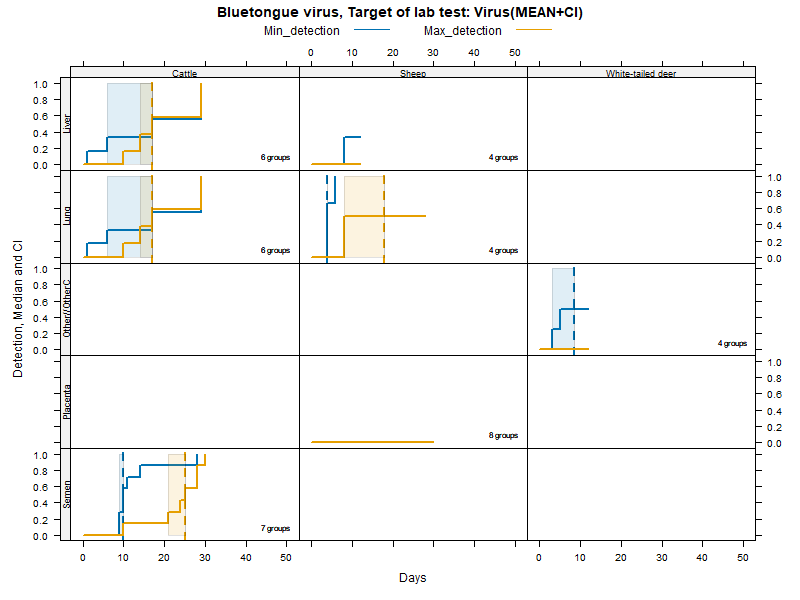
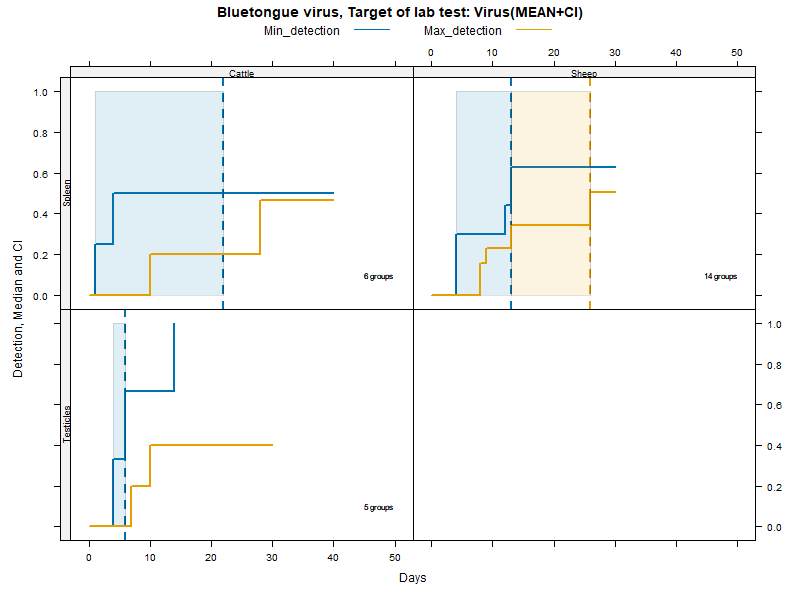
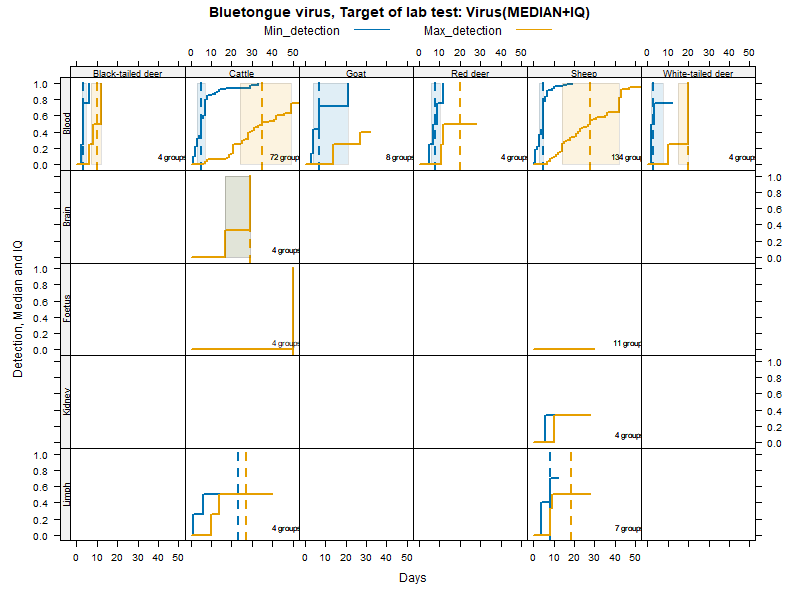
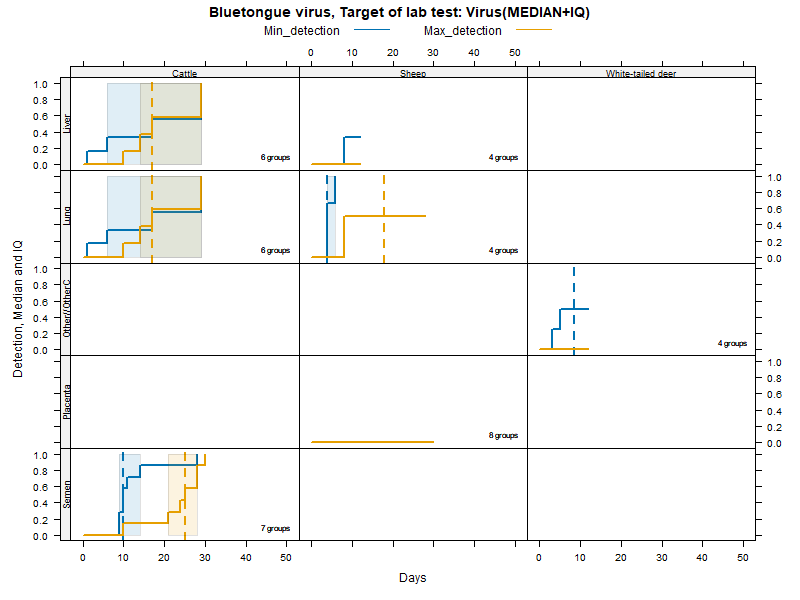
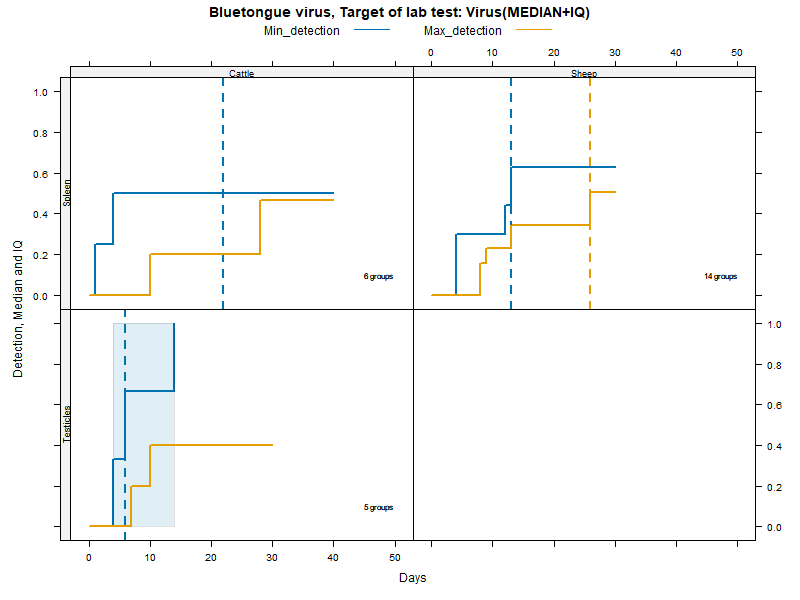
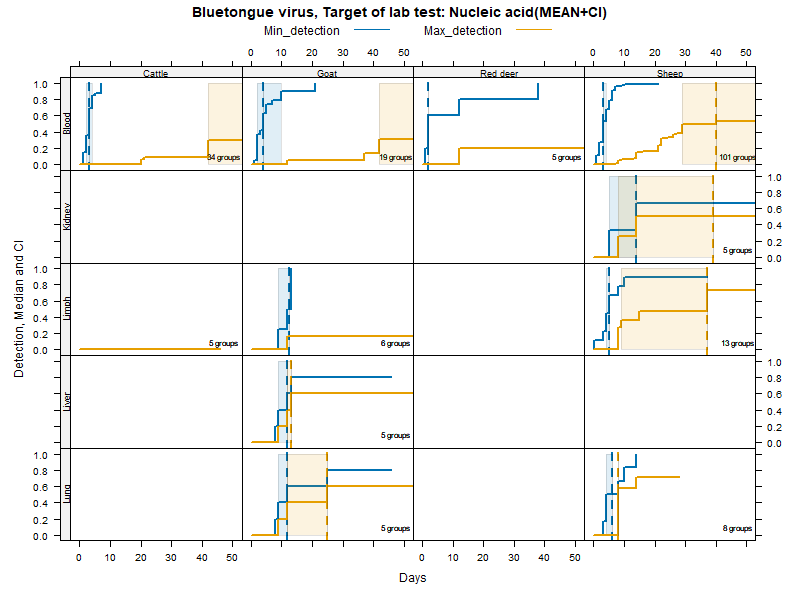
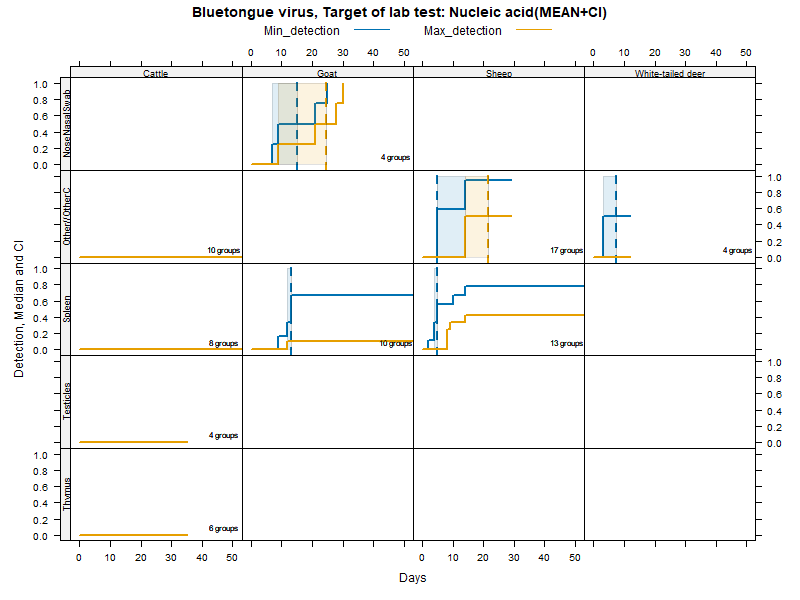
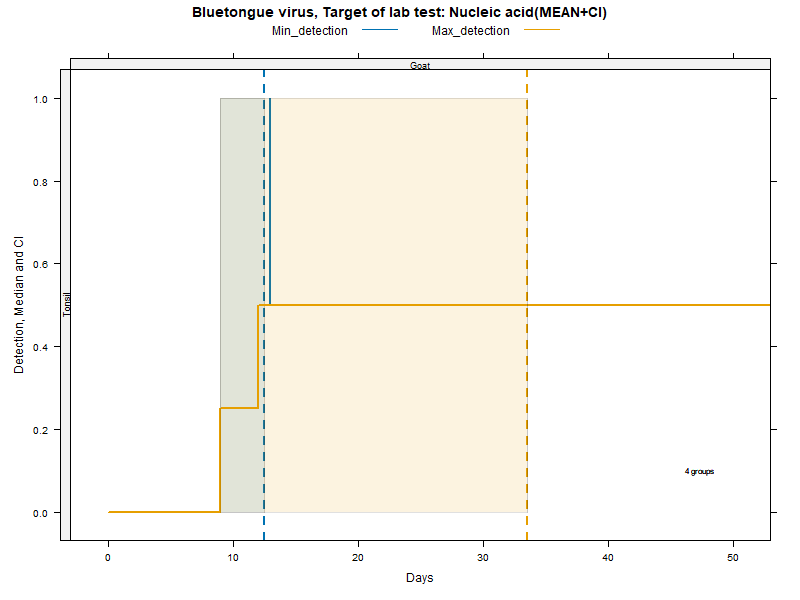
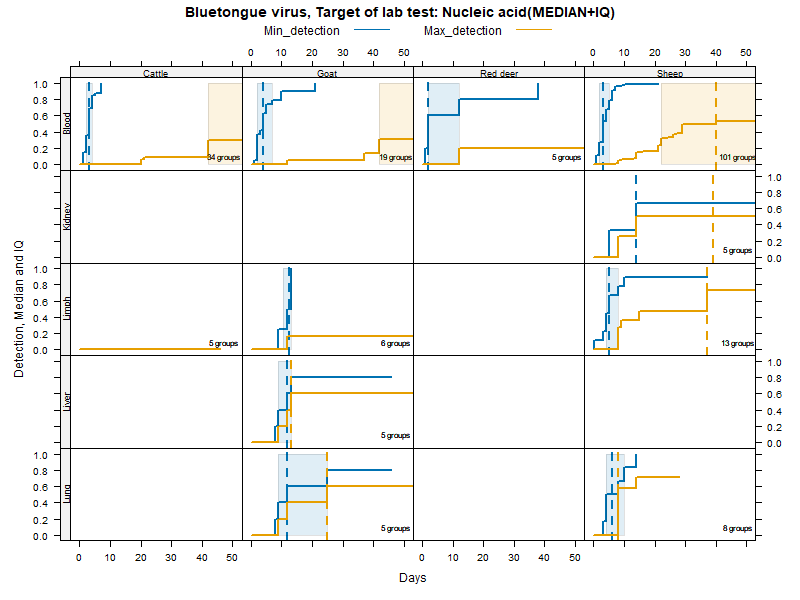
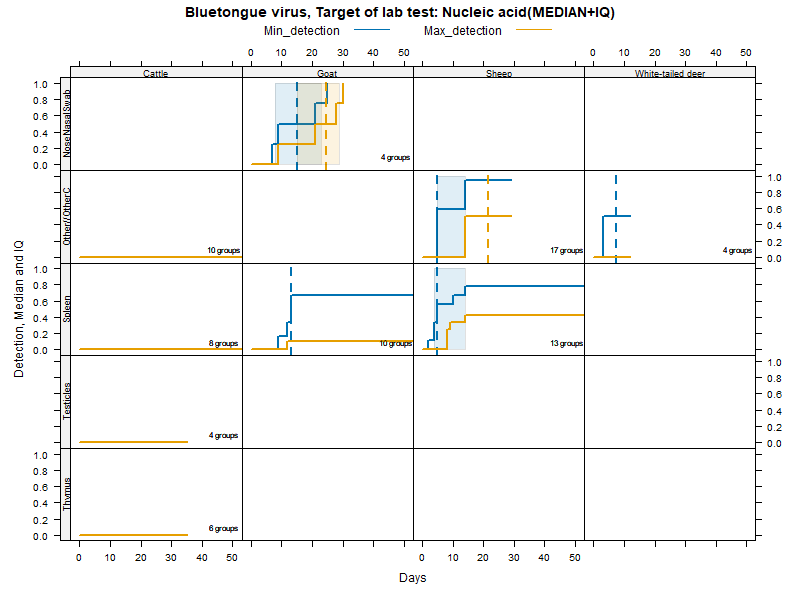
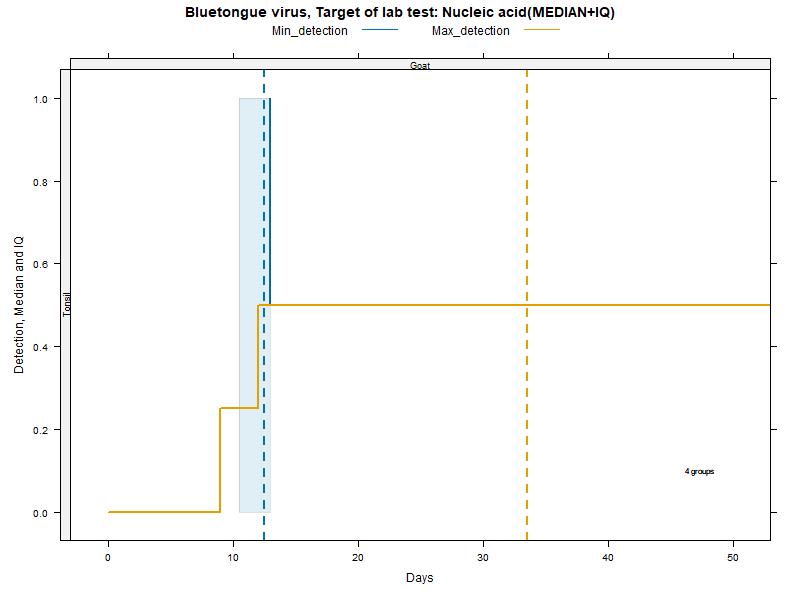
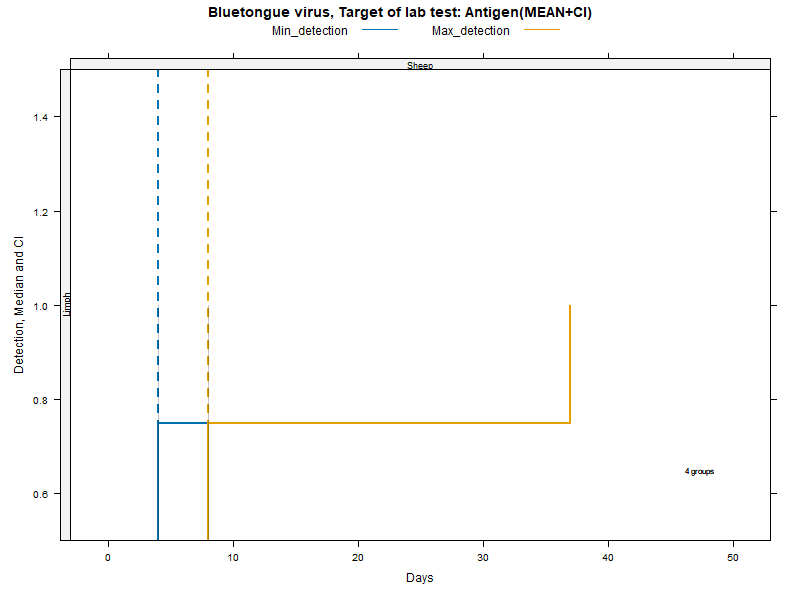
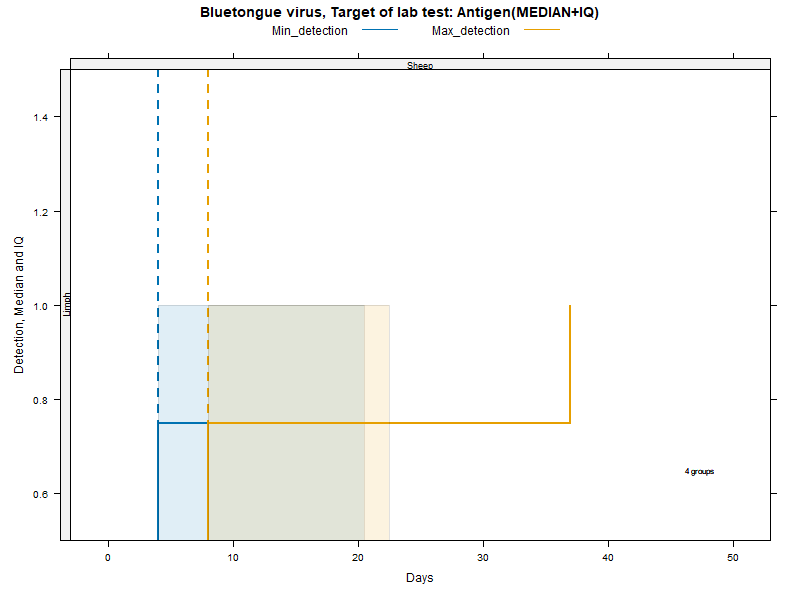
Kaplan-Meier curves were fit to the data in order to estimate parametric confidence intervals (CI) and interquartile ranges (IQ) that explicitly take into account the data censoring issue (lack of information about true maximum when experiments ended while virus was still detectable). Further below you will find a table with the numerical values.

Meta-analysis have been applied separately for VIRUS ISOLATION, detection of genetic material (DNA/RNA), and detection of virus ANTIGENS in species/matrices combinations where data was available for at least FOUR animal groups. The median minimum and maximum days during which virus/genetic material were detected in other matrices are listed in a table further below.

Row

Kaplan-Meier curves with parametric Confidence Intervals - Virus isolation

Row

Kaplan-Meier curves with Inter-Quantile Ranges - Virus isolation

Row

Virus isolation - Duration accounting for censoring - numerical values

LCL and UCL stand for the lower and upper control limit of a 95% confidence interval accounting for censoring (lack of information about true maximum when experiments ended while virus was still detectable).

N.groups is the number of animal groups from which experimental infection data was available.

Row

species matrix parameter n.groups median LCL UCL IQ1 IQ3
2 Black-tailed deer Blood Min_detection 4 3 2 NA 2.5 4.5
3 Black-tailed deer Blood Max_detection 4 10 6 NA 7 12
4 Cattle Blood Min_detection 70 5 5 7 3 7
5 Cattle Blood Max_detection 70 38 30 49 24 55
6 Cattle Brain Min_detection 4 29 17 NA 17 29
7 Cattle Brain Max_detection 4 29 17 NA 17 29
8 Cattle Limph Min_detection 4 23 1 NA 3.5 NA
9 Cattle Limph Max_detection 4 27 10 NA 12 NA
10 Cattle Liver Min_detection 6 17 6 NA 6 29
11 Cattle Liver Max_detection 6 17 14 NA 14 29
12 Cattle Lung Min_detection 6 17 6 NA 6 29
13 Cattle Lung Max_detection 6 17 14 NA 14 29
14 Cattle Semen Min_detection 7 10 9 NA 9 14
15 Cattle Semen Max_detection 7 25 21 NA 21 28
16 Cattle Spleen Min_detection 6 22 1 NA 2.5 NA
17 Cattle Spleen Max_detection 6 NA 28 NA 28 NA
18 Cattle Testicles Min_detection 5 6 4 NA 4 14
19 Cattle Testicles Max_detection 5 NA 10 NA 10 NA
20 Goat Blood Min_detection 7 7 4 NA 4 21
21 Goat Blood Max_detection 7 NA 27 NA 27 NA
22 Red deer Blood Min_detection 4 8 5 NA 6 10.5
23 Red deer Blood Max_detection 4 20 11 NA 11.5 NA
24 Sheep Blood Min_detection 130 5 4 5 3 5
25 Sheep Blood Max_detection 130 28 23 42 16 42
26 Sheep Foetus Min_detection 11 NA NA NA NA NA
27 Sheep Foetus Max_detection 11 NA NA NA NA NA
28 Sheep Kidney Min_detection 4 NA 6 NA 6 NA
29 Sheep Kidney Max_detection 4 NA 10 NA 10 NA
30 Sheep Limph Min_detection 7 8 4 NA 4 NA
31 Sheep Limph Max_detection 7 18.5 8 NA 8 NA
32 Sheep Liver Min_detection 4 NA 8 NA 8 NA
33 Sheep Liver Max_detection 4 NA NA NA NA NA
34 Sheep Lung Min_detection 4 4 4 NA 4 6
35 Sheep Lung Max_detection 4 18 8 NA 8 NA
36 Sheep Placenta Min_detection 8 NA NA NA NA NA
37 Sheep Placenta Max_detection 8 NA NA NA NA NA
38 Sheep Spleen Min_detection 14 13 4 NA 4 NA
39 Sheep Spleen Max_detection 14 26 13 NA 13 NA

Row

Kaplan-Meier curves with parametric Confidence Intervals - DNA/RNA detection

Row

Kaplan-Meier curves with Inter-Quantile Ranges - DNA/RNA detection

Row

DNA/RNA detection - Duration accounting for censoring - numerical values

LCL and UCL stand for the lower and upper control limit of a 95% confidence interval accounting for censoring (lack of information about true maximum when experiments ended while virus was still detectable).

N.groups is the number of animal groups from which experimental infection data was available.

Row

species matrix parameter n.groups median LCL UCL IQ1 IQ3
2 Cattle Blood Min_detection 32 3 2 4 2 4
3 Cattle Blood Max_detection 32 140 42 NA 42 167
4 Cattle Limph Min_detection 5 NA NA NA NA NA
5 Cattle Limph Max_detection 5 NA NA NA NA NA
6 Cattle Other//OtherC Min_detection 9 NA NA NA NA NA
7 Cattle Other//OtherC Max_detection 9 NA NA NA NA NA
8 Cattle Spleen Min_detection 7 NA NA NA NA NA
9 Cattle Spleen Max_detection 7 NA NA NA NA NA
10 Cattle Testicles Min_detection 4 NA NA NA NA NA
11 Cattle Testicles Max_detection 4 NA NA NA NA NA
12 Cattle Thymus Min_detection 6 NA NA NA NA NA
13 Cattle Thymus Max_detection 6 NA NA NA NA NA
14 Goat Blood Min_detection 16 4 2 10 2 6
15 Goat Blood Max_detection 16 575 42 NA 42 575
16 Goat Limph Min_detection 6 12.5 9 NA 10.5 13
17 Goat Limph Max_detection 6 NA NA NA NA NA
18 Goat Liver Min_detection 4 10.5 8 NA 8.5 12.5
19 Goat Liver Max_detection 4 12.5 9 NA 10.5 34
20 Goat Lung Min_detection 4 10.5 8 NA 8.5 18.5
21 Goat Lung Max_detection 4 18.5 9 NA 10.5 40
22 Goat Spleen Min_detection 8 12.5 9 NA 10.5 13
23 Goat Spleen Max_detection 8 NA NA NA NA NA
24 Goat Tonsil Min_detection 4 12.5 9 NA 10.5 13
25 Goat Tonsil Max_detection 4 33.5 9 NA 10.5 NA
26 Red deer Blood Min_detection 5 2 2 NA 2 12
27 Red deer Blood Max_detection 5 98 98 NA 98 NA
28 Sheep Blood Min_detection 94 3 3 4 3 5
29 Sheep Blood Max_detection 94 40 29 105 22 105
30 Sheep Kidney Min_detection 4 34.5 5 NA 5 NA
31 Sheep Kidney Max_detection 4 NA NA NA NA NA
32 Sheep Limph Min_detection 10 4 3 NA 3 8
33 Sheep Limph Max_detection 10 15 9 NA 8.5 NA
34 Sheep Lung Min_detection 7 4 4 NA 4 8
35 Sheep Lung Max_detection 7 18 8 NA 8 NA
36 Sheep Spleen Min_detection 9 4 4 NA 4 10
37 Sheep Spleen Max_detection 9 NA 9 NA 8.5 NA

Row

     Data for all matrices

Row

As pointed out above, meta-analyses were conducted only when data were available for at least four animal groups. Median values for all detection data collected in the systematic literature review (even when no meta-analyses were performed) are reported in the table below.

N.groups is the number of animal groups from which experimental infection data was available. The entire dataset can be downloaded through the link on the left panel.

Row

Species matrix N.groups minDetect (MEDIAN days) maxDetect (MEDIAN days)
Alpaca Blood 2 2.0 20.5
Alpaca Serum 1 2.0 28.0
Alpaca Spleen 1 106.0 106.0
American buffalo Blood 1 4.0 42.0
Black-tailed deer Blood 4 3.0 10.0
Camel Blood 2 6.0 38.0
Cattle Blood 103 4.0 30.0
Cattle Blood//Other//OtherC 2 7.0 21.0
Cattle BoneMarrow 3 7.0 7.0
Cattle Brain 4 18.5 18.5
Cattle Cervix 1 NA 6.0
Cattle FoetusStillbirthNeonatus 4 23.0 22.0
Cattle FollicularFluid 1 NA 6.0
Cattle Heart 1 2.0 14.0
Cattle Heart//Kidney//Liver//Ovary//Spleen//Uterus 1 NA 28.0
Cattle Kidney 3 3.5 14.0
Cattle Limphonode 8 35.5 35.0
Cattle Liver 6 14.5 15.5
Cattle Lung 9 20.0 20.0
Cattle Other//OtherC 5 35.0 35.0
Cattle Ovary 1 NA 6.0
Cattle Placenta 1 NA 21.0
Cattle Semen 8 10.0 26.5
Cattle Serum 1 3.0 28.0
Cattle Spleen 13 35.0 35.0
Cattle Testicles 9 35.0 30.0
Cattle Thymus 8 35.0 35.0
Cattle Uterus 3 23.0 6.0
Cattle Vagina 3 7.0 6.0
Dog Blood 2 2.0 14.0
Goat Artery 2 12.5 33.5
Goat Blood 21 4.0 32.0
Goat EyeEyeSwab 4 7.0 21.0
Goat FoetusStillbirthNeonatus 2 32.0 32.0
Goat Heart 3 13.0 25.0
Goat Kidney 3 13.0 25.0
Goat Limphonode 6 12.5 35.5
Goat Liver 4 10.5 12.5
Goat Lung 4 10.5 18.5
Goat MammaryTissue 2 13.0 34.0
Goat NoseNasalSwab 5 9.0 28.0
Goat Pancreas 1 13.0 13.0
Goat PeyerPatches 1 55.0 55.0
Goat Placenta 1 13.0 43.0
Goat SalivaryGland 1 55.0 55.0
Goat Skin 1 7.0 24.0
Goat Spleen 8 12.5 49.0
Goat Tongue 3 12.0 43.0
Goat Tonsil 4 12.5 27.5
Goat Uterus 1 13.0 43.0
Llama Blood 1 2.0 35.0
Llama Serum 1 2.0 28.0
Llama Spleen 1 106.0 106.0
Red deer Blood 8 6.0 28.0
Red deer Limphonode 2 28.0 28.0
Red deer Skin 2 14.0 14.0
Red deer Spleen 2 28.0 28.0
Sheep AdrenalGland 2 NA 18.0
Sheep Artery 1 8.0 8.0
Sheep Blood 231 4.0 21.0
Sheep Brain 1 NA NA
Sheep FoetusStillbirthNeonatus 9 19.0 19.0
Sheep Heart 3 8.0 11.0
Sheep Intestines 3 6.0 11.0
Sheep Kidney 7 7.0 10.0
Sheep Limphonode 14 4.0 8.5
Sheep Liver 6 9.0 10.5
Sheep Lung 10 6.0 8.0
Sheep Muscle 1 6.0 11.0
Sheep not investigated/not given/not relevant 2 3.0 35.0
Sheep NotReported 2 8.5 15.0
Sheep Pancreas 2 NA 18.0
Sheep Placenta 8 12.0 15.5
Sheep SalivaryGland 1 10.0 10.0
Sheep Semen 1 NA 14.0
Sheep Skin 4 4.5 7.0
Sheep Spleen 22 10.0 13.0
Sheep Thyroid 1 7.0 11.0
Sheep Tongue 1 6.0 11.0
Sheep Tonsil 6 5.5 11.5
Wapiti elk Blood 4 3.0 9.0
Wapiti elk BoneMarrow 1 NA 190.0
Wapiti elk Spleen 1 NA 190.0
White-tailed deer AdrenalGland 1 8.0 28.0
White-tailed deer Blood 3 2.0 20.0
White-tailed deer Heart 1 8.0 28.0
White-tailed deer Intestines 1 8.0 15.0
White-tailed deer Kidney 1 8.0 28.0
White-tailed deer Limphonode 1 8.0 28.0
White-tailed deer Liver 1 8.0 28.0
White-tailed deer Lung 1 8.0 28.0
White-tailed deer Spleen 1 8.0 28.0

Row

     INFORMATION SECTION

Row

This is important information about the data collection process, to keep in mind when interpreting the evidence shown. This information is also available in the info button within the respective sections.

Row

Duration of clinical signs:

Please note that experimental infections are generally conducted in ANIMAL GROUPS.

Species listed are those for which evidence was available in peer-reviewed literature (in English).

Please note also that:

  1. “Infectious period” cannot be measured directly unless transmission experiments are also conducted. Infection experiments reviewed in the literature actually measured the period of time during which the pathogen/genetic material could be detected in specific body matrices.

  2. All data were recorded per ANIMAL GROUP, not individually. As a result, the periods were recorded in the form of “minimum” and “maximum” values (in days) observed in the group. The values therefore do not reflect a distribution of infectivity in a single animal, but the earliest and latest day in which the pathogen/genetic material could possibly be detected in specific body matrices.

  3. Animals could still be “infectious” on the last day of the experiment. Data in this case is censored - the maximum represents the maximum observed, not the true maximum.

Data collected from matrices other than blood, and calculations of the infectious period were provided above.

Back to duration of the infectious period.

Row

     REFERENCES

Row

In the left panel you can find information about the entire systematic literature review. The specific references for this agent, and used in this section of the story map are listed below.

Row